Choose the pages and reporting period
Open Reports and select New report. Choose the pages you want to include, then set the date range, report title, brand name, and brand colour before selecting Customise →.
Help centre›Marketing plan reports
Reports guideSee which slides Crow can populate from performance data, where your context is needed, and what to check before sharing the report.
Open Reports and select New report. Choose the pages you want to include, then set the date range, report title, brand name, and brand colour before selecting Customise →.
In Sections, the YourCrow Marketing Plan reference shows all 30 slides in order. Introduction covers the company and audience, Marketing Strategy covers services and positioning, and Implementation covers channels, evidence, budget, funnel, risks, and next steps.
Automatic slides use report dates, page metrics, recommendations, experiments, leads, GA4 evidence, and commentary. Mixed slides combine that data with your context. Input slides need details only you can provide, such as audience, budget, team, pricing, and contact information.
Use Metrics, Commentary, and the other report controls to include or remove metrics, recommendations, experiments, leads, and commentary. Add page notes when a result needs client or campaign context.
Select Create report, check every section, and correct missing context before sharing. You can choose Download HTML or Print / Save PDF from the completed report toolbar.
These captures use a fictional Sample Studio workspace. No customer information appears in the images or recording.
A silent desktop walkthrough showing New report, Customise →, section customisation, Create report, opening the finished report, and the Print / Save PDF control.
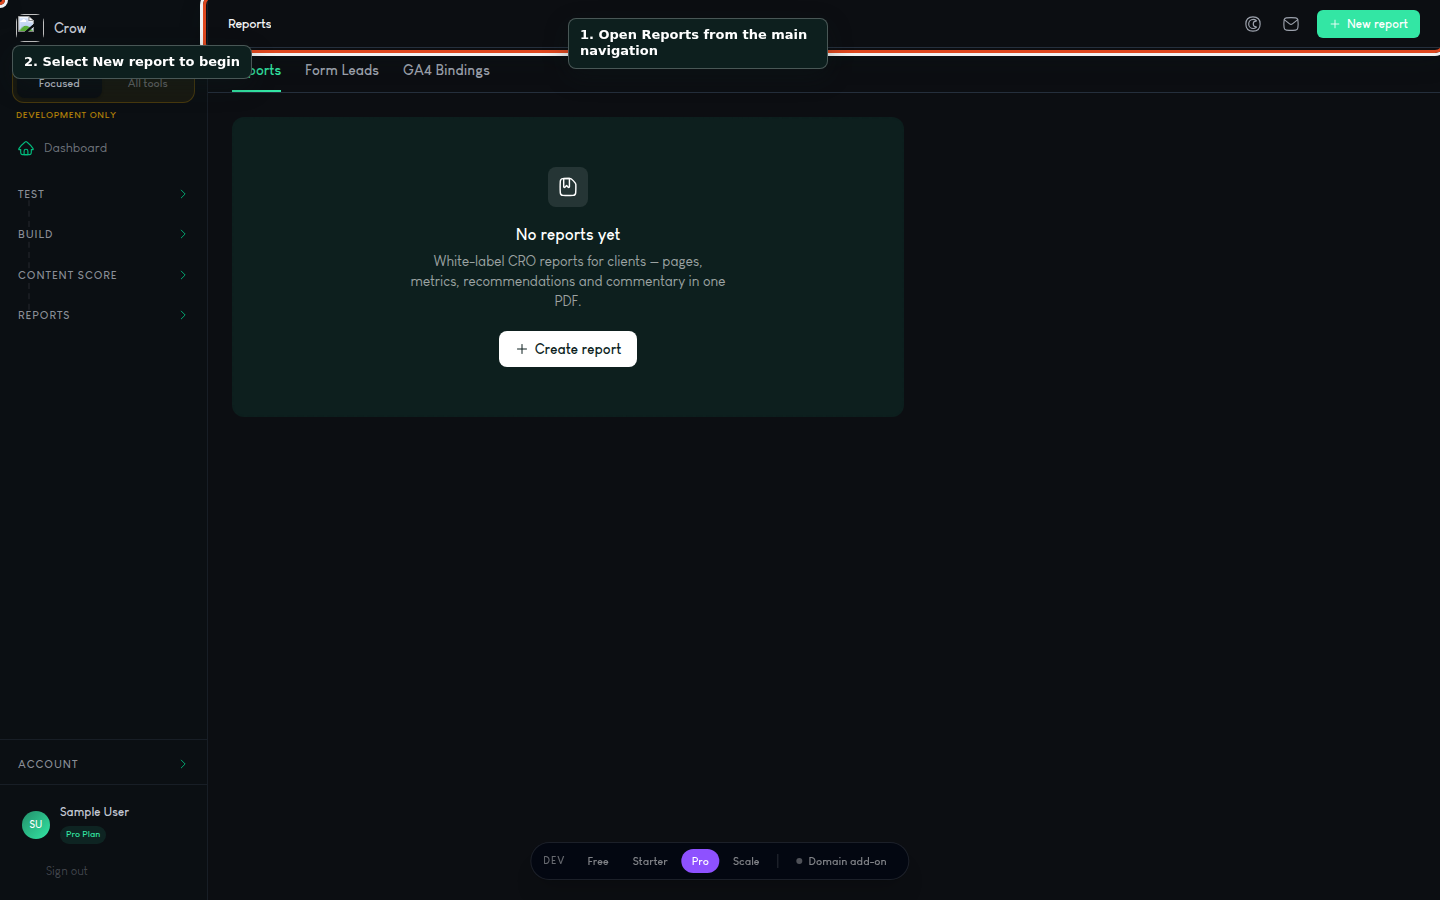
Start in Reports, then select New report in the page header.
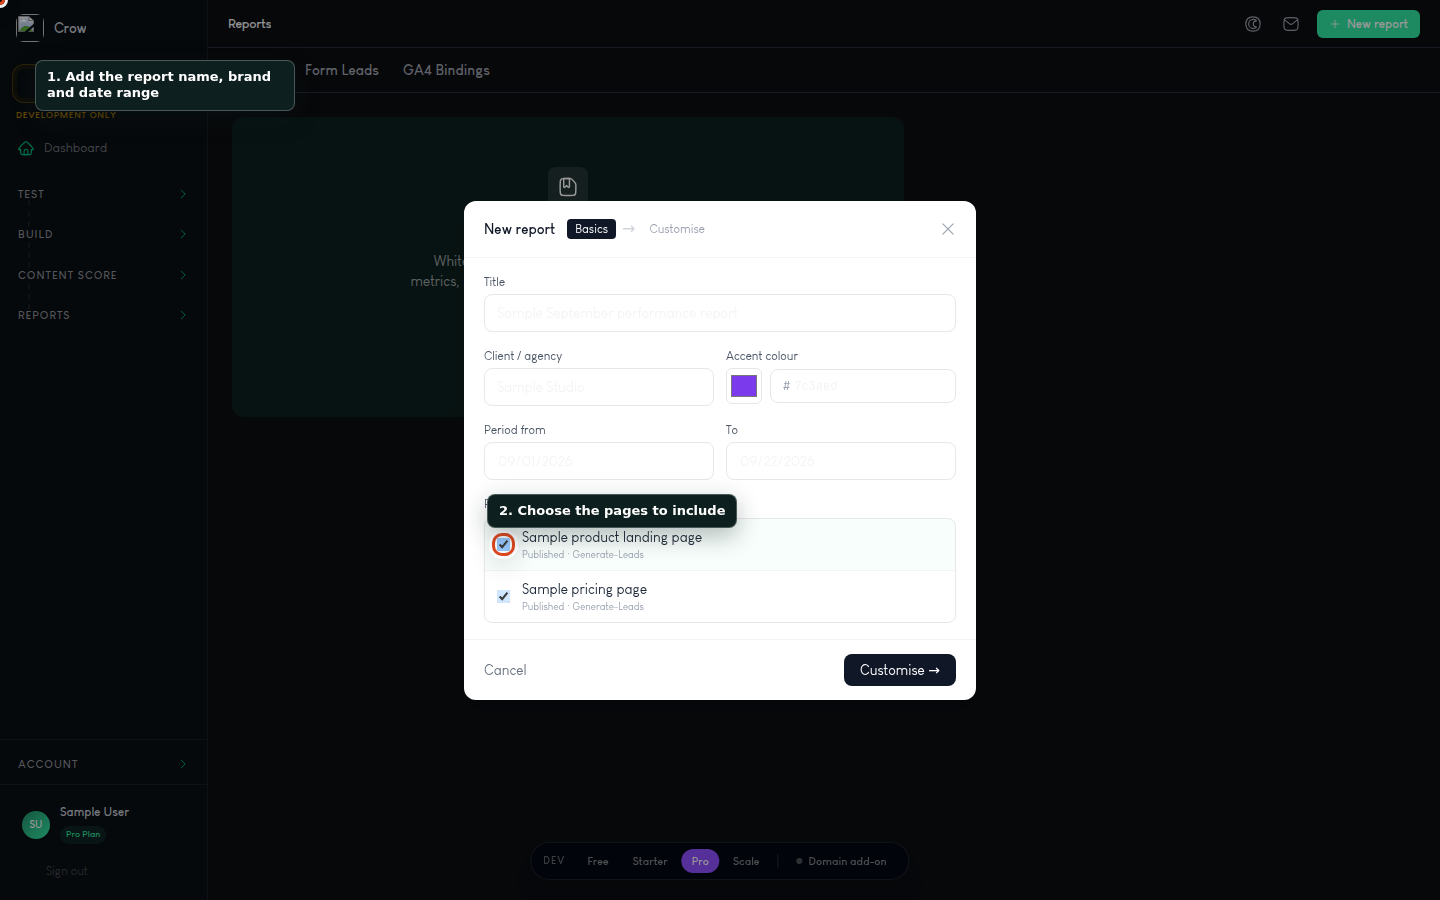
Name the report, set the period and choose the pages. The example uses sample data only.
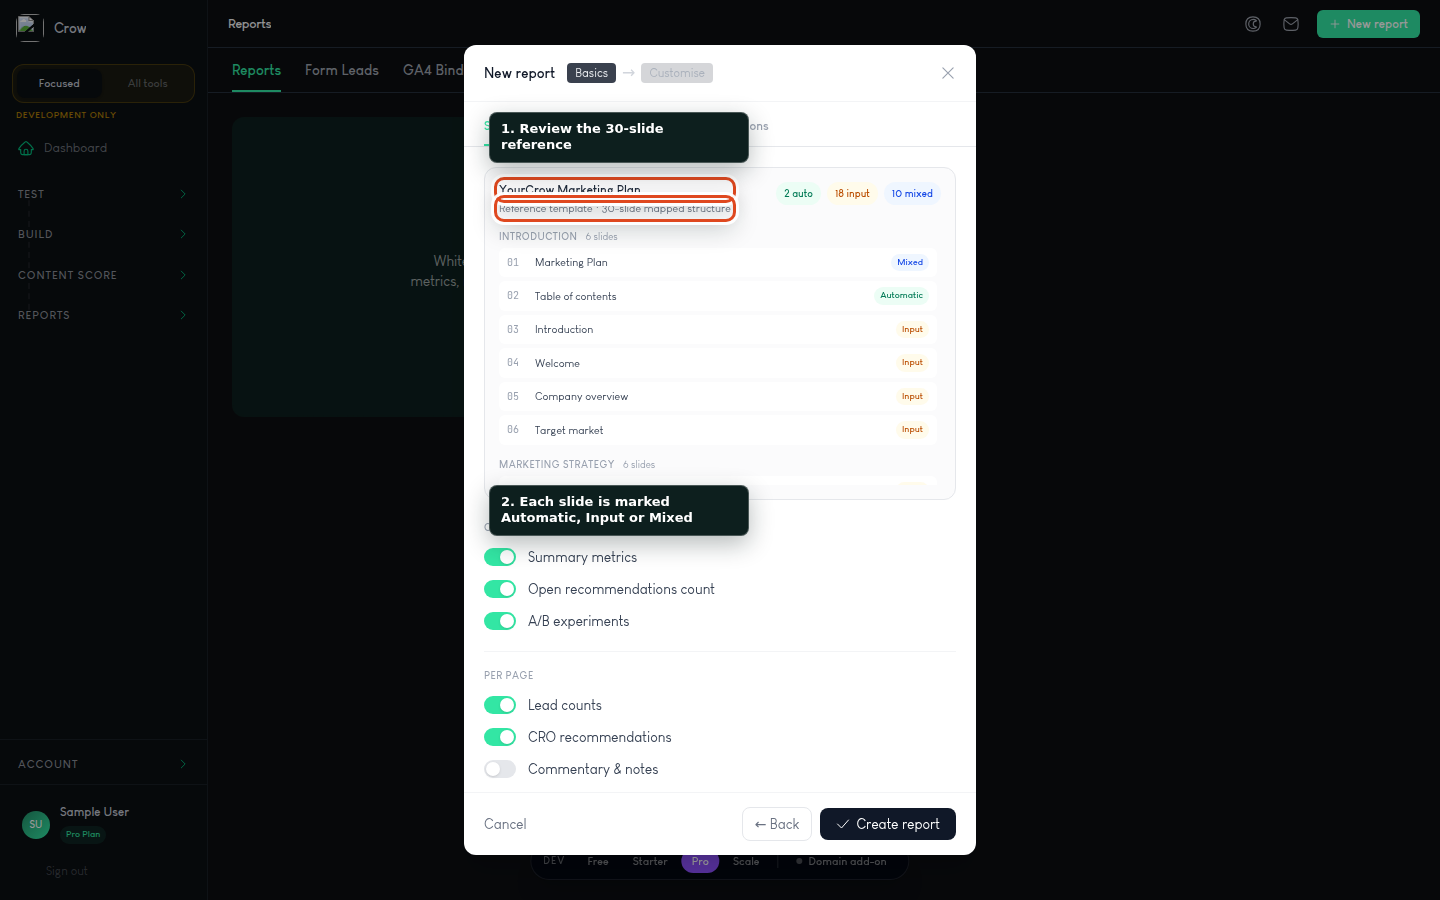
The Sections tab shows the reference order and what Crow can populate for each slide.
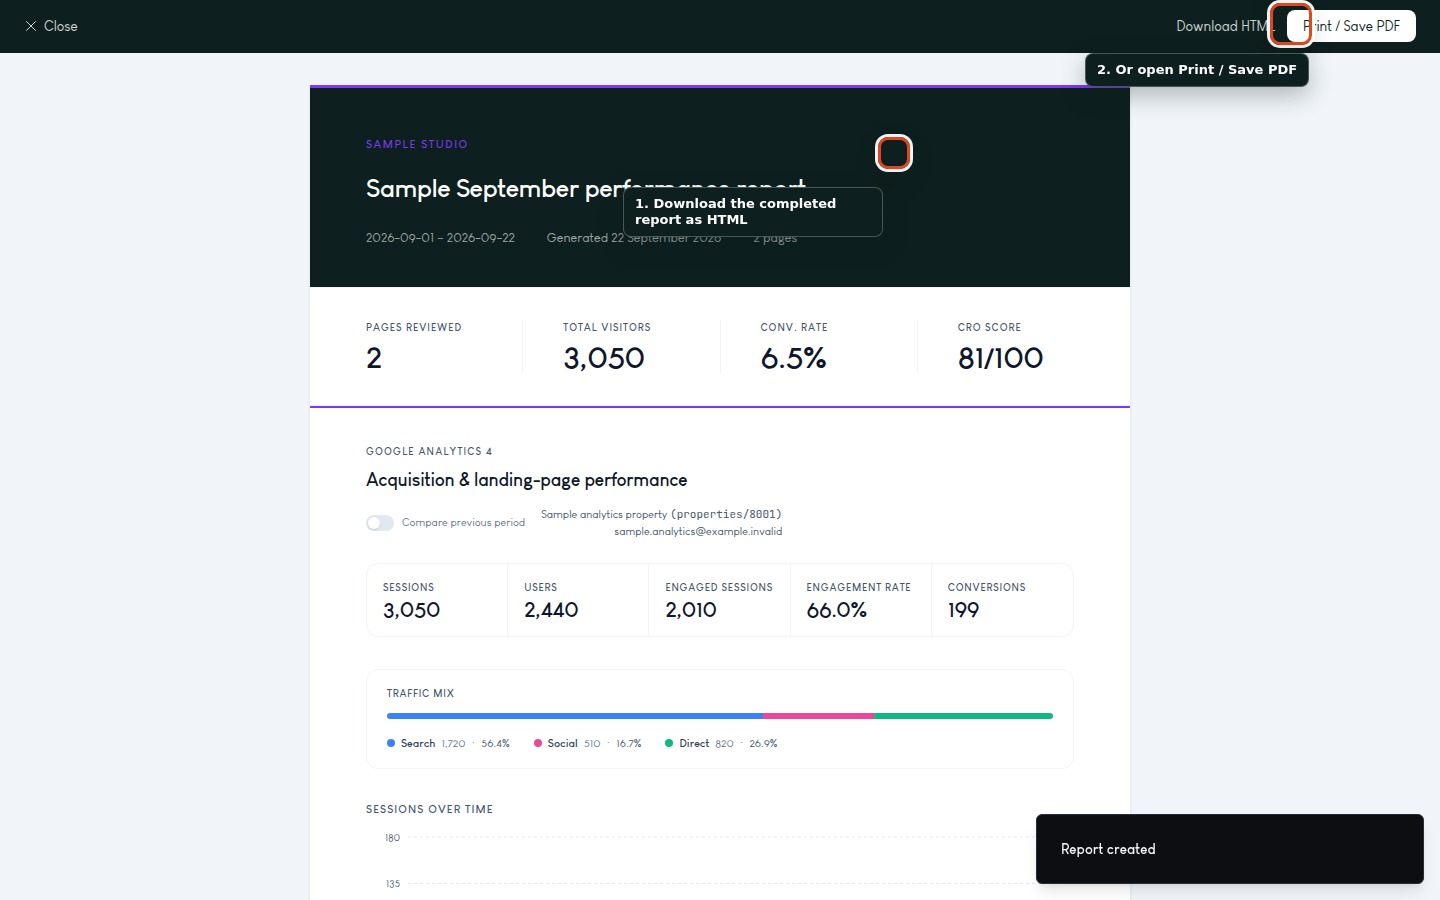
Open the report and use the toolbar to choose Download HTML or Print / Save PDF.
The label beside each slide tells you whether Crow has enough data to populate it responsibly.
Crow already has the source data. Examples include reporting dates, performance metrics, recommendations, experiments, leads, and GA4 evidence.
Crow supplies evidence, but you add business context. Examples include the performance dashboard, channel comparison, funnel, case study, and risk plan.
The slide needs marketer-approved information. Examples include vision, audience, competitor analysis, calendar, budget, team, pricing, and contact details.
The 30-slide view is a content mapping reference. For now, open a completed report and choose Download HTML or Print / Save PDF. A generated PowerPoint is not available yet.
Not yet. The structure maps the reporting content to the uploaded YourCrow Marketing Plan template. Current saved reports use Download HTML or Print / Save PDF. PowerPoint generation is a separate export step.
Crow can report what happened on your pages, but it should not invent your audience, budget, positioning, team, pricing, or approved customer proof. Those fields stay clearly marked as input.
Check the date range, selected pages, brand details, metrics, recommendation count, commentary, and every input field. Remove placeholders and confirm any customer quote, pricing, budget, or contact detail.